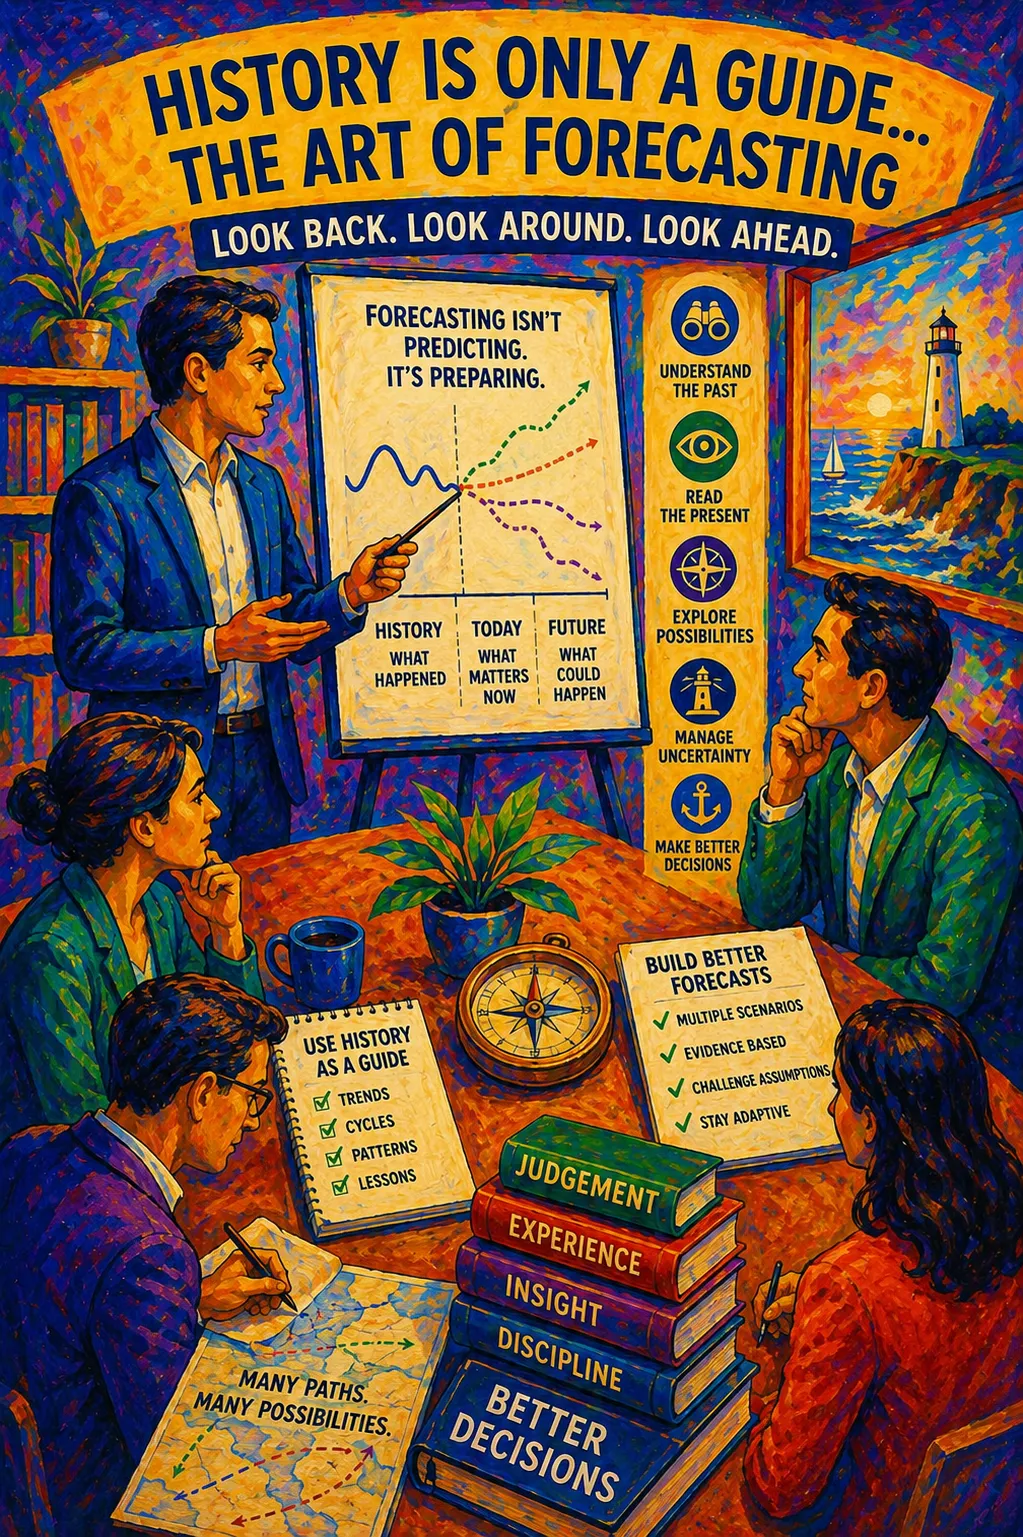
In the world of investing, history is often treated as a map of the future. Financial analysts frequently rely on past data such as historical growth rates, market drops (drawdowns), and price valuations to set the boundaries for what might happen next.
This reliance on history is being tested, as equity markets trend close to their historical extremes on these measures. Earnings growth is running way above its long term trend and valuations are elevated on almost every measure.
This uncertainty has sparked a single, dominant question in the market today: Are we in an AI bubble? Answering it through forecasting is a complex art. How well a model works depends heavily on your time horizon, the range of possible outcomes and the data that is put into it. To understand why, let's start with an example everyone can relate to: the weather.
Weather Models: Physics vs. History
Consider the city of Sydney. On average, Sydney enjoys about 245 dry days per year, meaning it doesn't rain roughly 67% of the time.
Now, imagine comparing two different ways to predict the weather:
- The Naive Historical Method: Simply guessing "It won't rain today" every single day (relying on Sydney's 67% dry baseline).
- The Physics Model: Using modern supercomputers to track fluid dynamics and atmospheric measurements.
In the short term, supercomputers win easily. But as time stretches out, their accuracy decays:
- 5-Day Forecast: ~90% accurate
- 7-Day Forecast: ~80% accurate
- 10-Day Forecast: ~50% accurate
- 1-Month Forecast: Decays to near 0% predictive skill
By Day 30, a complex weather model provides no new useful information beyond a simple guess. This is due to a concept known as Atmospheric chaos, or more commonly, the Butterfly Effect (discovered by meteorologist Edward Lorenz in 1961). Tiny errors in initial measurement compound exponentially over time. If a sensor in the Pacific Ocean misreads the water temperature by just 0.01 degrees celcius, that tiny error is harmless on Day 1. But by Day 3, it shifts a coastal breeze; by Day 7, it moves a storm system by 100 miles; and by Day 14, it’s the difference between a sunny afternoon and a thunderstorm.
When looking 30 days into the future, atmospheric chaos makes simple history a better guide than physics. Bet that it won't rain on Day 30, and you’ll be right 67% of the time. Rely on a 30-day computer projection, and you'll actually be right less often (~55%) because the model creates "fake" storms out of mathematical noise.
Financial Modelling
The variables, timeframes, and range of potential outcomes determine how accurate any forecast can be. Finance is no different; however, the accuracy is flipped.
Unlike weather forecasts, which are great in the short term and fail in the long term - financial forecasting is highly inaccurate in the short term (<1 year), but becomes much more reliable over long horizons (5 to 10+ years).
The most common financial model used to predict the future is mean reversion. In plain English, mean reversion simply looks at history's average and assumes financial metrics (such as PE ratios, credit spreads and currency cross-rates) will eventually return to that average over time.
Much like assuming ‘it won't rain’ based on historical averages, mean reversion uses past data with no extra real-time inputs. In the short term, this strategy frequently fails because markets are erratic. But over a decade or more, financial metrics usually return to their underlying economic averages.
When History Breaks
So, what are the traps of relying purely on historical averages?
Throughout history, economic ‘regimes’ shift, and historical norms work right up until they don't. Unprecedented ‘Black Swan’ events happen, and they are called Black Swans precisely because no historical chart saw them coming:
- “U.S. home prices don't fall nationwide at the same time": A historical baseline that held for decades, right until the 2008 Great Financial Crisis (GFC). Sound familiar Aussie readers???
- "Value stocks always beat Growth stocks over time": This held true for nearly a century, until post-2008 central bank interest rate cuts allowed tech and growth stocks to dominate for over a decade.
- "Commodity prices can never go below zero": Yet during the 2020 pandemic lockdowns, oil crashed to -$37 (yes that is minus $37) a barrel because there was literally nowhere left to store it. You got paid to take physical oil.
- "Bonds can't have negative interest rates": Yet by 2020, nearly $18 trillion of global government debt traded with negative yields, turning traditional safe havens into what investment writer Jim Grant famously called "return-free risk."
If you relied solely on historical averages during any of these moments, your short-term predictions would have failed miserably.
Adding ‘Human Overlays’ to the Model
Can we build a ‘physics model’ for finance to catch these shifts? Yes, but it requires humans to make subjective adjustments (either manually or via human created computer programs) and overwrite past data when fundamental rules change. This introduces a range of outcomes based on the quality of the human judgment / model. The reason this approach tends to be poor in the short term can be illustrated by technological innovation which routinely breaks human models. The US shale oil revolution is a great illustration of how this can play out.
Example: The US Shale Oil Revolution
When crude oil prices fell below $50 a barrel in 2014 (below the marginal cost of production), standard historical models predicted that high-cost American oil producers would shut down, reducing supply and forcing prices back up.
Instead, hydraulic fracturing (fracking) and horizontal drilling technology advanced rapidly, driving production costs down to $30 - $45 a barrel. Technological innovation permanently shifted the cost curve lower, keeping global oil prices depressed far longer than historical models predicted.
Today, investors face similar structural shifts. If Artificial Intelligence boosts productivity across the economy, will historical corporate profit averages shift higher? If AI replaces certain jobs, will baseline unemployment rise?
In Conclusion
Great investors balance using history as a guide without treating it as an immutable law.
In weather forecasting, history becomes more useful than complex models at around the 14 day mark. In finance, that inflection point is harder to pinpoint, but one rule remains constant:
If you rely only on history, expect unexpected regime shifts to catch you off guard.
If you apply subjective overlays to your models, remain humble about what you don't know.
In today's context, it is unlikely that any one individual knows the future impact that AI will have on the economy or financial markets. There are simply too many variables. The only road map we have is the historical averages, historical technological innovations themselves and the current starting point.
Words to Invest By
"History is the study of change, ironically used as a map of the future."
Morgan Housel, The Psychology of Money
"History doesn't repeat itself, but it often rhymes."
Mark Twain
"If past history was all that was needed to play the game of money, the richest people would be librarians."
Warren Buffett